I took a class in my last semester of business school in 2013 that was about analyzing networks. For our final project, I worked on a team that analyzedDharmesh Shah’s twitter followers. The goal was to identify who might be a good candidate to make an introduction. Below is the complete writeup as we submitted it to our professor, Marissa King.
Problem
Dharmesh Shah is an influential entrepreneur and angel investor. He is the co-founder and CTO of HubSpot, a technology company headquartered in Boston. Dharmesh invests in many early-stage startup companies each year, and entrepreneurs routinely court him as a mentor and investor. As an incredibly busy executive and investor, Dharmesh is not an easy man with whom to get an audience.
Our group set out to analyze Dharmesh’s network to find the most influential people. By identifying the most connected people in his circles and the networks in which they operate, someone could prioritize their efforts in getting introductions.
Hypothesis
A strategy to influence Dharmesh starts with influencing those who can influence him. Therefore, we built our analysis on two hypotheses:
- Dharmesh’s network looks similar to our own, in that it has important sub-networks.
- Within these communities, there are people who can influence Dharmesh.
If network analysis can identify these influential individuals, one could effectively surround Dharmesh, gaining connections to him from a variety of his networks.
Methodology
Our analysis uses information gathered from Twitter rather than LinkedIn or Facebook. Twitter is unique and different from these two social networks because it is public by default. Twitter has an asymmetric follower pattern where anyone can subscribe to the updates of another person; both parties do not have to choose to connect. Since many in the technology community use Twitter as a news and information service, it would be a good indication of whom someone respects and looks to for interesting and influential information.
To analyze who is influential to Dharmesh, the analysis focused on people Dharmesh currently follows. Through the twitter API, we downloaded:
- The twitter accounts that Dharmesh follows
- The twitter accounts that follow those accounts
We downloaded over 10 million pieces of follower information as pairs of directed edges (the people that influence Dharmesh, and the people that follow those influencers). We put the data into a relational database so that we could model the edges and query it on an ad-hoc basis.
In order to determine the influencers within the network of people that Dharmesh follows, we created a graph of the mutual connections. We only graphed a connection between two people if they both followed each other. This removed many edges in our graph because many relationships only had a single directed edge. We felt that this was a better indication of a relationship and would highlight communities of influence more effectively.
Analysis
Looking at Twitter data instead of Facebook or LinkedIn has the advantage of portraying what Dharmesh is currently working on and thinking about, as opposed to his entire personal or professional network. This has the benefit of identifying what will pique his interest, since we assumed that he only follows people that share content that is interesting to Dharmesh.
In analyzing the network graph, there are clusters that represent the Boston startup community, Silicon Valley, and HubSpot employees and alumni. Contrary to the graphs of our personal network analysis, the groups were highly integrated with one another and were hard to distinguish. We believe this to be the case because anyone can follow anyone else on Twitter; there is no expectation of being friends or having worked together professionally. If someone is sharing interesting content on Twitter, individuals are accustomed to following others they may not have met in real life. We believe that explains the lack of separation of subgroups that are present in the Facebook and LinkedIn network graphs.
Our group expected to see more subgroups that are distinct in Dharmesh’s network of influencers. In our professional and personal graphs, we each had communities that represented high school, college, professional groups, and graduate school networks. We were only able to identify three separate sub groups in Dharmesh’s graph, with only one company and two regional communities. While surprising at first, we believe it is driven by the interaction that takes place on Twitter. Rather than accumulating contacts, Twitter is about what is interesting to you at the current time and many users regularly unfollow others based on their tweets. This is very different from Facebook or LinkedIn, where you rarely remove a friend.
It is not surprising that Silicon Valley represented a significant element of Dharmesh’s graph of influencers, since the region is the largest in terms of venture capital and startups. Boston did not represent more of the influencers graph, but again that may have been influenced by the fact that Silicon Valley is responsible for a majority of the innovation in the technology and startup industry. There were two subgroups that represented members of the Boston startup community, which is interesting considering that HubSpot has been one of the fastest growing startups in Boston for many years. For any entrepreneur looking to gain access to Dharmesh, it represents two opportunities for identifying individuals. Additionally, it may indicate that there are few influencers in the HubSpot community that have a strong following in Boston or Silicon Valley. That makes sense given that Dharmesh is one of the most highlighted entrepreneurs in Boston and one of the biggest public faces of his company.
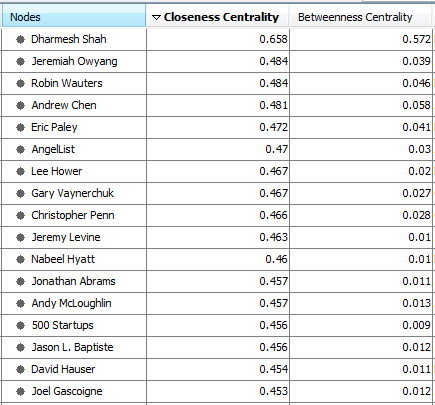
In order to identify the people in each subgroup that would be helpful in influencing Dharmesh and the people he follows, we analyzed thebetweenness and closeness centrality for each person in the graph. In this analysis, we sought to identify people who could influence Dharmesh, but would be accessible because they are not as popular and sought after as a mentor and investor. As an entrepreneur would, we inspected the highly ranked individuals to determine who would result in the best outcome. If the person were as popular as Dharmesh, it would not make sense to reach out to him or her.
Recommendations
To get in front of Dharmesh, it is important to look not only at the closeness centrality of the target contact, but also his or her role in the industry and how likely he or she would be able to connect you to Dharmesh. The person with the highest closeness centrality is actually an industry analyst for Altimeter Group, which is a research and advisory firm. Without additional knowledge, a target such as Jeremy Owyang would likely offer industry insight, but not potential contacts, since many would likely look to him for market research.
Instead, we would recommend trolling through the list ranked by closeness centrality and cross-referencing it with information that can be gathered elsewhere. With this approach, Jeremy Levine, David Hauser, Dan Abdinoor and Eric Paley seem to be the best targets. Jeremy Levine and David Hauser are both young entrepreneurs that Dharmesh follows that are deeply connected to the Boston startup community. While they have already established a reputation in the Boston VC community, they are likely more open to and available for meetings. Dan Abdinoor has worked at several startups in Boston, and is at the center of the HubSpot subgroup even though he is no longer employed by HubSpot. This is most likely due to the fact that he was one of the first ten employees hired and stayed through tremendous growth.
Potential Contacts that influence Dharmesh:

Dharmesh’s Twitter network graph:

Thanks to Jason Koster, Jake Berliner, and Seth Taft for letting me publish our analysis on my account here.
Recent Comments