In my time as a product manager, I was constantly reminding myself to talk to customers more. It might have been to talk about existing features, something under development, or customer pain and processes for product research. It was easy in the beginning, because we knew most of the people using the tool as we worked on the initial version. Even as we got bigger, my feelings usually boiled down to these four words: talk to customers more. I think a critical skill, however, is learning how to talk to the right customers.
As I worked on the HubSpot sales products and we grew it to hundreds of thousands of active users, I quickly realized I couldn’t speak to everyone. I needed to be strategic about who I reached out to, and the type of feedback I was looking for. It’s a dangerous path to go down, because you can end up wasting time by over-analyzing your data and getting into analysis paralysis. Even worse, in my opinion, is taking the existing feedback as representative of your user base, and only solving for the loudest segment of the customers or the customers that are most convenient to interact with.
I want to share the process that Brian Balfour showed me. It’s fairly easy (and inexpensive!) to identify who you should reach out to, and collect their feedback.
Step 1: Identify who you want to speak with
Are you working on activation? If so, you want to target people who sign up but don’t really get started or see value. If you’re working on retention, you need to dig into why someone would start to use it but end up quitting your product. Not sure which one you should be solving for? It depends.
Step 2: Find those people
Any good behavioral analytics system will allow you to look at the number of events that someone has done over time. Let’s say we want to find users who start to use the product, but then stop. Most analytics systems will tell you the raw number of times an event happened, or the unique users that did it. Here’s a sample from the Amplitude demo for when someone plays a song:
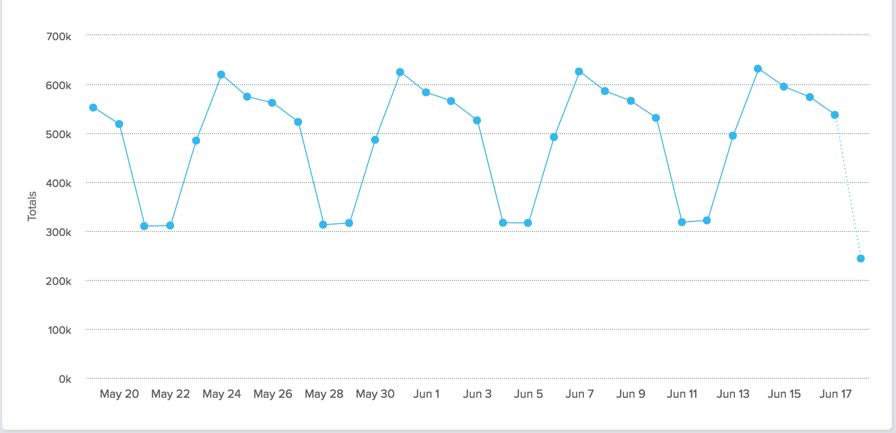
The graph above is great for evaluating trends, but the goal is to speak with individual users about their experience. You need to go a level deeper and visualize this data on an individual user level. You should be able to get it by the user’s email. Once you have that, export it to Excel so you can play with it more closely.
For the next images, imagine I exported data that has the number of events someone performed on a daily basis for my app’s most important events. I then would create a pivot table:
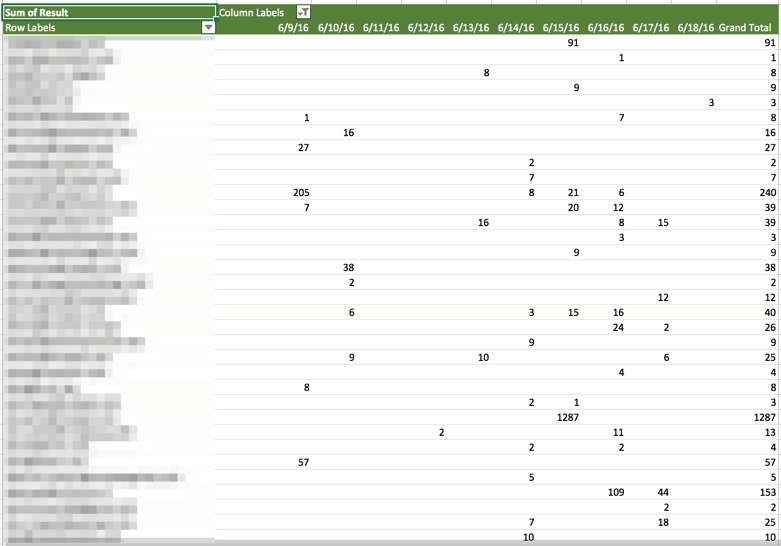
This pivot table has a list of email addresses in the first column, alongside the number of times an event happened per day. You could do the same on an hourly / daily / weekly / monthly basis, depending on what makes sense for your app.
Next, I typically do some more filtering to evaluate who I could speak with. I set up this filter to find the people that weren’t active on 6/18, but were active on 6/16 or 6/17. I expect people to use my app every day, and I am shocked when they don’t. I’m curious to know why they didn’t use it.
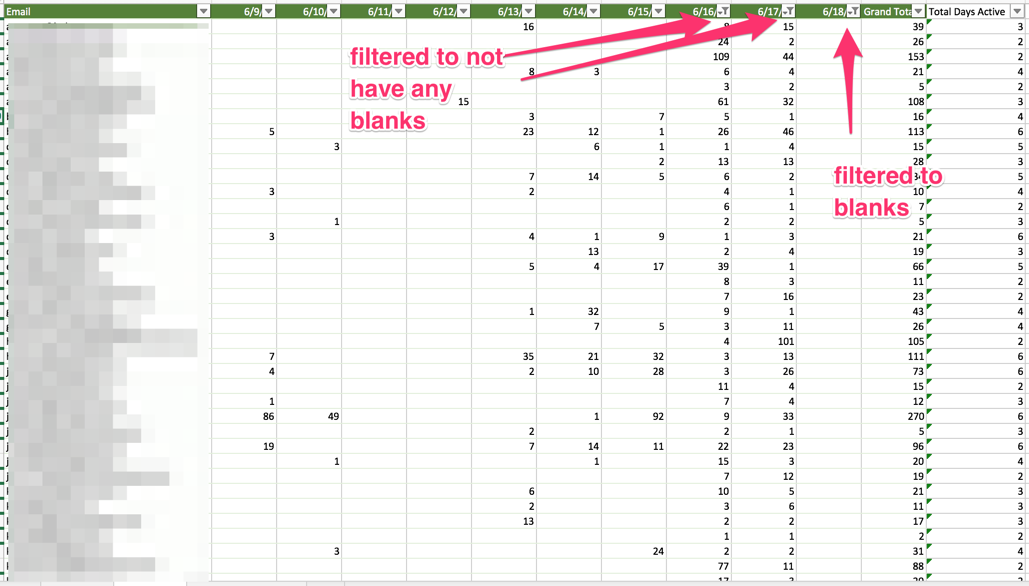
You could spend a lot of time doing this type of analysis. I’d try to limit yourself to less than thirty minutes of playing with a spreadsheet like the above. I’d bucket your search into a couple of categories:
Super active users:
- They use the crap out of your product, consistently. I’d be curious to speak with them to understand what they like about your product and why it’s so valuable to them.
Drive by users:
- People who check out your application quickly and then leave, never to return. What was their impression? Why didn’t they stick around? If you’re using a product like Fullstory, are you able to see what they did in your product?
Engaged people who quit
- I’d look for people who used it for a minimum of some period (a month? Multiple weeks?) and then stopped using it. These people presumably understand at least a portion of your product, but then took action to stop using it.
- As you can see in the screenshot, I added a column where I computed the number of days someone had performed an action. If done over weeks / months, this is helpful to quickly find the users who were long term users.
Step 3: Reach out to users
This should produce some users that you want to speak with. Now comes the fun part! I took the list of emails, and I send them an email soliciting feedback. This is where I hear a ton of complaints from product managers like “I don’t have enough people to email” or “people never click through to the survey.”
I typically get 10–20% response rates on the emails that I send out. My secret is that I send out the emails from my Gmail account. I BCC lists of users and when I contacted them so I have a record and don’t email people multiple times. This works for multiple reasons:
- It ends up in their inbox, not the promo inbox
- It feels more personal, there’s no professional email template
- One final key: they only have to respond to give you feedback. Nobody wants to click on a link to fill out a survey.
Here’s the email that I send out:
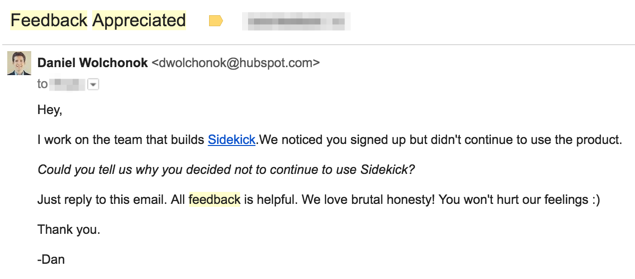
Nobody wants to click on a link to fill out a survey, even if it’s a one question survey. I often get back soliloquies from users with incredibly valuable feedback. I’m grateful, and I also reply back to the emails multiple times doing a typical five whys analysis. This is another reason why it’s superior to embedding a google form into an email.
Step 4: Collect / Analyze the feedback
If you choose to send out this survey to a large group of people, it’ll quickly become difficult to report off the trends and high level information. This is where I use Zapier.
I connect the Gmail and Google Docs zaps like this:
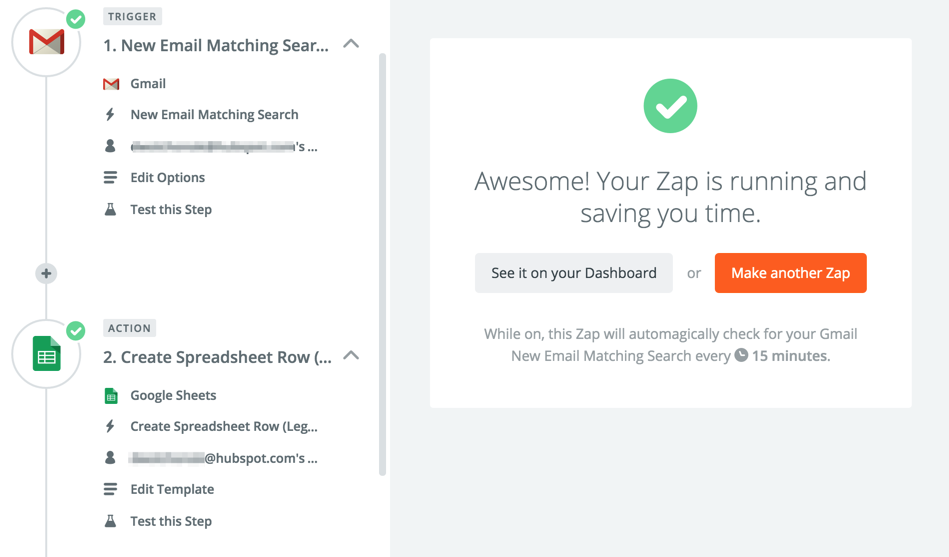
I filter the responses to the survey into a custom label so it doesn’t overload my inbox. I use Zapier to pull the responses into a Google Spreadsheet, so I can easily read them and bucket the responses:
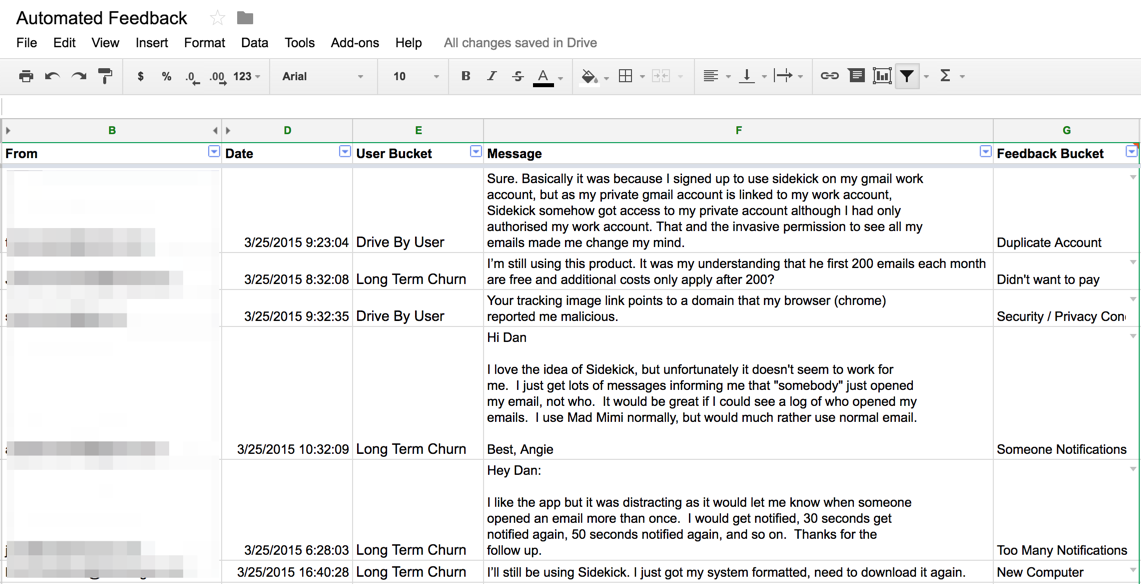
You can see that I have manually gone through and added a feedback bucket for each of the responses. I try to bucket reasons in a handful of categories, and look for common language patterns for how people describe problems. That allows me to create reports for development teams that look like the following:
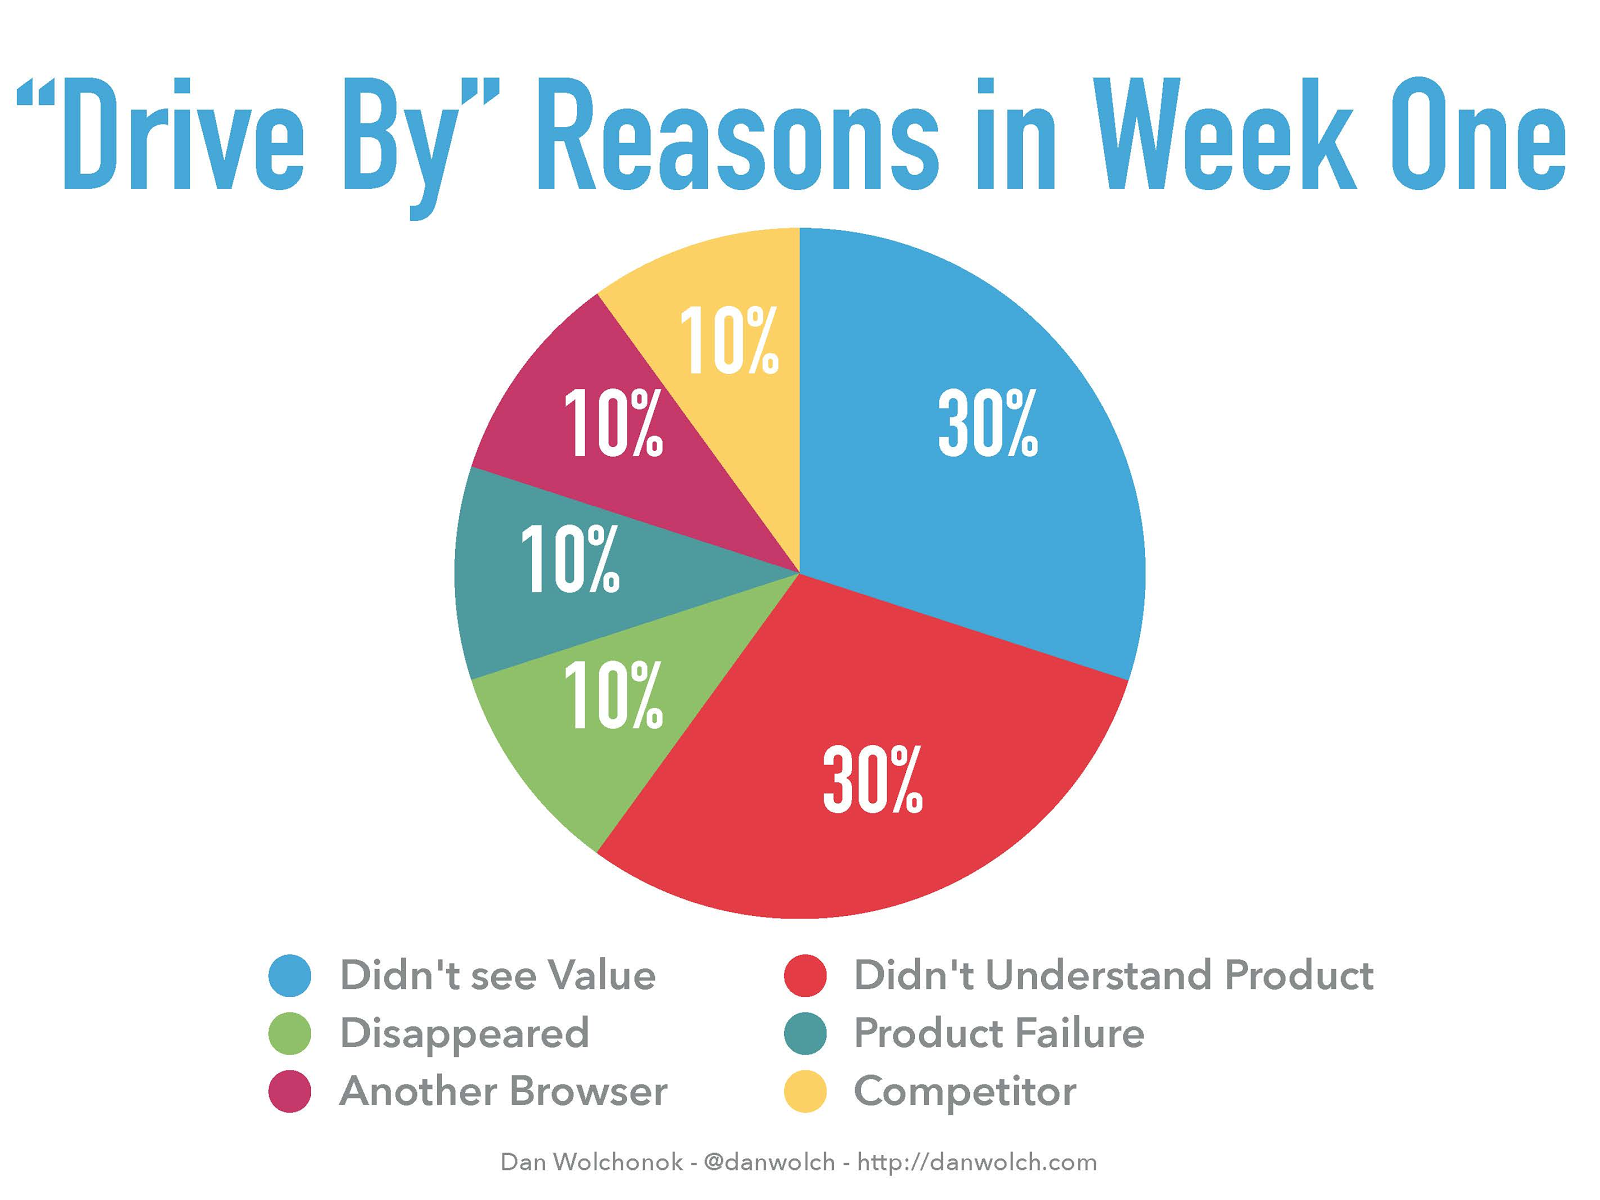
The value isn’t in doing this with free or low friction tools — the value is in the insight you get into your users and what they love or hated about your product. I’m sure that there are fancy tools that help with this type of analysis, but the bottom line is that you don’t have an excuse for not doing this type of process. It works incredibly fast, produces results, and is free (other than your existing analytics system). I like this because it gets you really close to your users and their behavior, and allows you to quickly get your hands dirty and get some actionable feedback.
How could this process be better? How do you find and the solicit feedback from the users that will have the biggest impact on your company? Let me know through a comment, or drop me an email (it’s on my personal blog).
Thanks to Magdalena Georgieva, Lars Osterberg, and Brian Balfour for reading drafts of this post.
0 Comments
6 Pingbacks